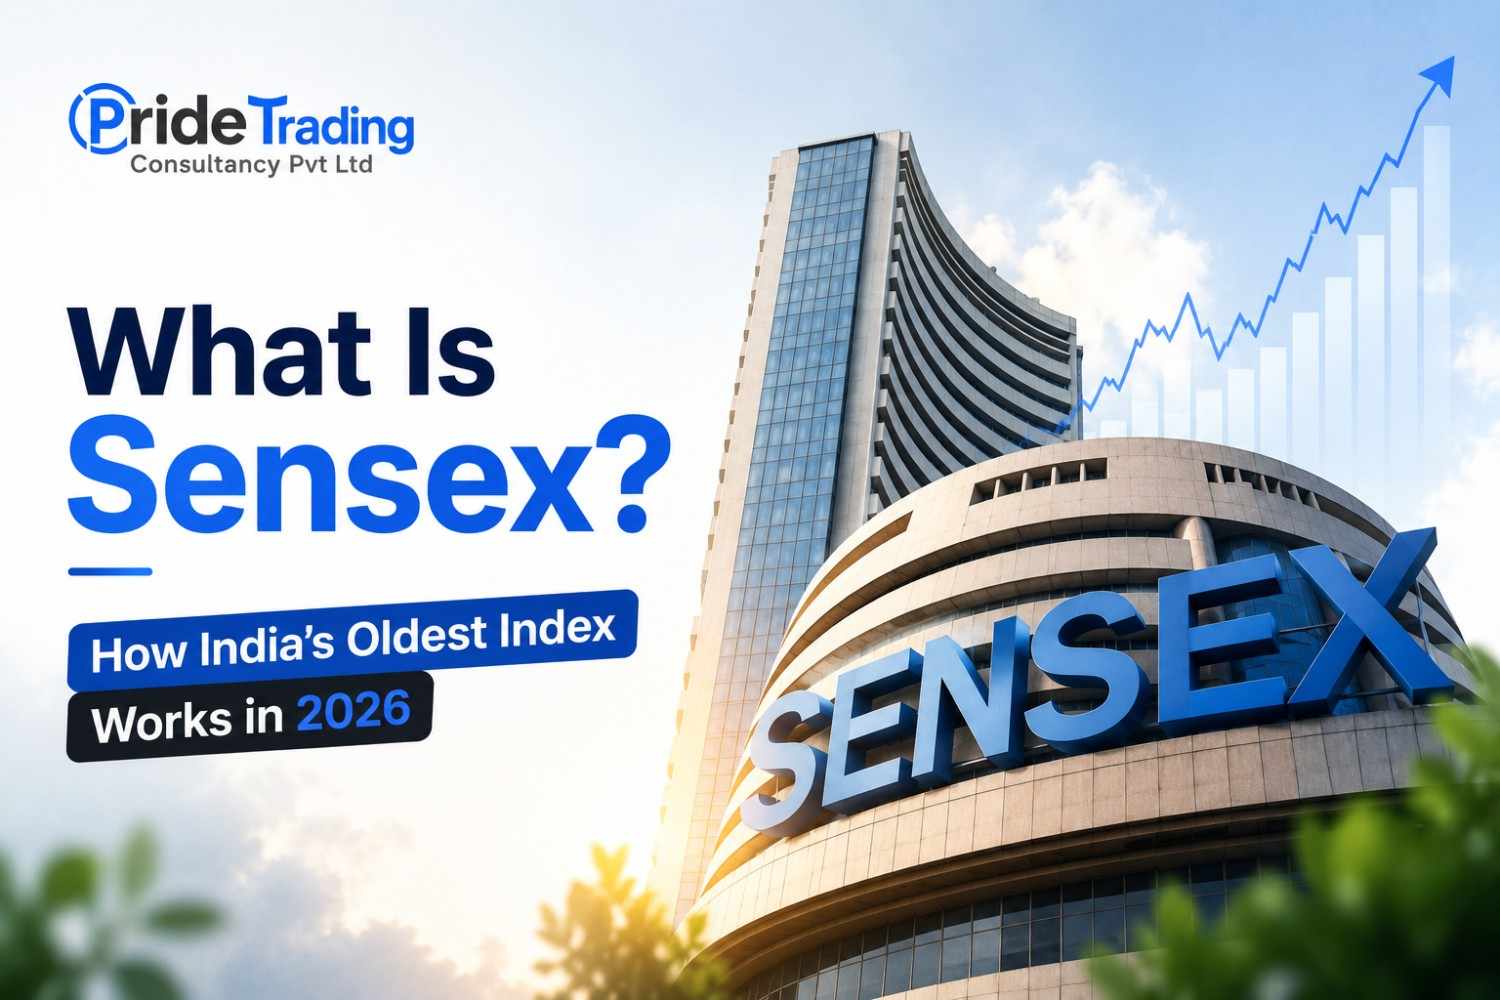
What Is Sensex and How Does It Work? Complete Guide 2026
Every morning, millions of Indians check two numbers before anything else.
Nifty. Sensex.
If you have ever heard someone say, "The market is up 500 points today," they are almost certainly talking about Sensex. It is one of the oldest and most watched financial numbers in India. Yet most people who track it daily cannot explain what it actually measures or how it moves.
This guide fixes that. By the end, you will understand what Sensex is, how it is calculated, why it matters, and exactly how it is different from Nifty 50.
TL;DR
Sensex is India's oldest stock market index. It tracks 30 of the largest companies on the Bombay Stock Exchange. One number tells you the direction of India's biggest businesses. When Sensex rises, the market is generally bullish. When it falls, sentiment is weak.
This is not financial advice. Consult an SEBI-registered research analyst before investing.
What Is Sensex?
Sensex stands for Sensitive Index. The name was coined by stock market analyst Deepak Mohoni in 1989.
It is a stock market index that tracks 30 of the largest and most actively traded companies on the Bombay Stock Exchange, also known as BSE India. These 30 companies represent some of the most important businesses in the Indian economy—across banking, technology, energy, consumer goods, and manufacturing.
One number captures the collective performance of those 30 companies. When all 30 are rising together, Sensex goes up. When they are falling together, Sensex drops. When they are mixed, Sensex reflects the net result.
As of June 2026, Sensex trades in the range of 80,000 to 82,000 points. It started at a base value of 100 in April 1979. That journey from 100 to 80,000 in roughly 47 years tells the story of India's economic transformation.
History of Sensex
Sensex was officially introduced on January 1, 1986, though it was back-calculated to a base year of 1978 to 1979 with a base value of 100.
For context, Sensex crossed 1,000 for the first time in 1990. It touched 10,000 in February 2006. It hit 50,000 in January 2021 during the post-pandemic recovery rally. And it crossed 80,000 for the first time in July 2024, driven by strong institutional buying, India's GDP growth, and record-breaking retail investor participation.
Every major milestone in Sensex history reflects something happening in India's real economy or in global markets.
The 1992 Harshad Mehta scam sent Sensex crashing after a speculative bull run. The 2008 global financial crisis wiped out 60 percent of Sensex value in a year. The 2020 COVID crash took it down 38 percent in 40 days. Each time, Sensex recovered and went higher. That long-term pattern is why investors use it as a gauge of India's economic resilience.
How Sensex Is Calculated
Sensex uses the free-float market capitalization method. This is the same method used by Nifty 50.
Here is what that means without the jargon.
Every company has a total market value, called "market capitalization." It is calculated by multiplying the share price by the total number of shares. But not all shares are freely available to trade. Promoters hold large stakes that never move in the market. "Free float" refers only to shares that are available for public trading.
The Sensex weighs each of its 30 companies based on their free-float market cap. A company worth more in free-float terms has more influence on the index. Reliance Industries, HDFC Bank, and ICICI Bank typically hold the largest weights in Sensex. If Reliance moves 3 percent, it pulls Sensex by more than if a smaller company moves the same 3 percent.
The formula produces an index value benchmarked to 100 in the base year. So Sensex at 80,000 means the combined free-float value of those 30 companies is 800 times what it was in 1979.
BSE reviews the Sensex composition twice a year. Companies that no longer meet the service criteria are replaced by ones that do. This keeps the index representative of current market leaders.
Companies Included in Sensex
As of mid-2026, the 30 companies in the Sensex include some of the most recognized names in Indian business.
Financial sector: HDFC Bank, ICICI Bank, Kotak Mahindra Bank, Axis Bank, State Bank of India, Bajaj Finance.
Technology: Infosys, Tata Consultancy Services, Wipro, Tech Mahindra, HCL Technologies.
Energy and Industrials: Reliance Industries, Larsen & Toubro, NTPC, Power Grid Corporation.
Consumer and FMCG: ITC, Hindustan Unilever, Asian Paints, Nestle India.
Auto and Manufacturing: Maruti Suzuki, Mahindra and Mahindra, and Tata Motors.
Pharma and Healthcare: Sun Pharmaceutical, Dr. Reddy's Laboratories.
The actual list changes through periodic reviews. You can always check the current official list at bseindia.com.
Financial services and IT together make up nearly half of the Sensex weight. This is why Sensex is sensitive to interest rate changes, RBI policy decisions, US Fed moves, and global technology spending trends.
Why Sensex Matters
Sensex is more than just a number. It performs several important functions.
It is a real-time barometer of market sentiment. If you want to know in 10 seconds whether investors are optimistic or worried about India today, you check Sensex. A green Sensex means buyers outnumber sellers in the 30 most important companies. A red Sensex means the opposite.
It serves as a benchmark. Mutual funds, portfolio managers, and investment advisors measure their performance against Sensex. If your fund delivered 12 percent and Sensex delivered 16 percent in the same period, your fund underperformed the benchmark. That comparison only makes sense because Sensex exists.
It reflects FII activity. Foreign institutional investors move large amounts of money in and out of Indian markets. When they buy, banking and large-cap stocks rise, and Sensex follows. When they sell, the opposite happens. Watching Sensex tells you the net result of all that activity in one number.
It is used in news and policy contexts. "Why is Sensex down today?" is one of the most searched questions in Indian financial news. The answer almost always connects to one of the following: global sell-offs, currency weakness, interest rate changes, geopolitical events, or weak corporate earnings.
Sensex vs Nifty 50
Both are stock market indices. Both track large Indian companies. But they are different in important ways.
Feature — Sensex — Nifty 50 Exchange — BSE — NSE Companies Tracked — 30 — 50 Base Year — 1978 to 79 — 1995 to 96 Base Value — 100 — 1,000 Managed By — BSE India — NSE Indices Ltd Current Level (June 2026) — ~80,000 — ~24,000
The biggest practical difference is breadth. The Nifty 50 tracks 50 companies, so it gives a wider picture of the market. The Sensex tracks 30, so it is more concentrated. Both move together almost all the time because there is significant overlap in the companies they include.
For trading, most professionals use the Nifty 50. Nifty has higher derivatives volume on NSE and is used in most F&O strategies. Sensex derivatives trade on BSE and are less popular among retail traders.
For long-term historical reference, Sensex is more commonly cited because of its older data going back to 1979.
How Investors Use Sensex
Understanding Sensex is one thing. Knowing how to use it as an investor is another.
Long-term investors use Sensex to track the big picture. If Sensex is above its 200-day moving average, the long-term trend is up. If it falls sharply below that level, it signals a deeper correction or bear market. This single indicator helps investors decide whether to add to their positions or stay cautious.
Mutual fund investors use Sensex as a return benchmark. Before choosing a fund, check whether it has beaten Sensex consistently over 3-, 5-, and 10-year periods. If it has not, a simple Sensex index fund might outperform it at lower cost.
Traders use Sensex and its relationship to global indices. US markets and Sensex are correlated. When the Dow Jones falls heavily overnight, the Sensex almost always opens lower the next morning. Gift Nifty, which trades at GIFT City in Gujarat, is also watched before Indian markets open as an early signal of direction.
Common Misconceptions About Sensex
Misconception 1 — Sensex represents all Indian stocks. It does not. It covers 30 companies. There are over 5,000 listed on BSE. A small-cap company you invest in may fall 20 percent even on a day Sensex rises.
Misconception 2 — When Sensex falls, you should sell everything. Not necessarily. Sensex can fall 2 percent in a day and recover fully the next week. Long-term investors who panic-sell on short-term dips consistently get worse returns than those who hold through volatility.
Misconception 3—Sensex at a high means every stock is expensive. Sensex reflects its 30 components. Mid-cap and small-cap stocks can still be attractively valued even when the Sensex is near all-time highs. Always evaluate individual stocks on their own fundamentals.
Glossary
Sensex: India's oldest stock market index tracking 30 of the largest companies on BSE. Full form is Sensitive Index.
Free-Float Market Capitalization: The total market value of only those shares of a company that are available for trading by the public.
BSE (Bombay Stock Exchange): Asia's oldest stock exchange, established in 1875. Home of Sensex.
Benchmark: A reference index used to measure the performance of a mutual fund or investment portfolio.
FII (Foreign Institutional Investor): Large foreign entities like overseas mutual funds and banks that invest in Indian stock markets. Their buying and selling significantly influences Sensex direction.
Base Value: The starting reference value of an index. Sensex started at 100 in 1979. All current values are multiples of that base.
Conclusion
What is Sensex? It is the single most important number in Indian stock market history. From 100 in 1979 to over 80,000 in 2026, it tells the story of India's growth, resilience, and the wealth created for investors who stayed invested through every crisis. Understanding Sensex does not make you an expert investor. But not understanding it puts you at a real disadvantage. Track it, understand what moves it, and use it as one tool in a bigger investment framework. At PrideCons, our SEBI registered research helps Indian investors make decisions based on data and analysis, not market noise. Registration number INH000010362.
Disclaimer
This blog is for educational and informational purposes only. This is not financial advice and should not be treated as a recommendation to buy or sell any security or fund.