How to Read Open Interest (OI) Data in Trading — A Complete Guide
You are watching Nifty on a trading platform. The price is going up. Looks like a buy signal. But before you act, you check the OI data—and it tells a completely different story. Open interest is falling even as price rises. That means the rally is being driven by old shorts covering their positions, not by fresh buyers entering the market. The moment those shorts finish covering, the move stops.
That is the difference between trading on hope and trading on data.
Open interest is one of the most powerful and most misunderstood numbers in the Indian derivatives market. Most retail traders ignore it. The ones who use it well have a significant edge. This guide breaks it down completely — in plain language, with real examples, and with a clear table you can reference every time you open an option chain.
What Is Open Interest (OI)?
Open interest is the total number of outstanding derivatives contracts—futures or options—that have not yet been settled, closed, or expired.
Every futures or options contract requires two parties: a buyer and a seller. When a new buyer meets a new seller, one new contract is created, and OI goes up by one. When an existing buyer and an existing seller both exit their positions, one contract is closed and OI goes down by one.
This is the critical distinction that most beginners miss:
OI is not the same as volume.
Volume counts how many contracts were traded on a particular day. It resets to zero every morning. OI counts how many contracts are still open and active. It carries forward from one session to the next.
Think of it this way. Volume is like tracking how many cars entered a parking lot today. OI is the count of how many cars are still parked inside.
Why OI Matters More Than Most Traders Realise
Price tells you where the market went. Volume tells you how active it was. Open Interest tells you who is committed.
When OI is rising, new money is entering the market—someone is opening a fresh position. When OI is falling, positions are being closed—traders are exiting. This context changes everything about how you interpret a price move.
A stock that rallies with rising OI is very different from one that rallies with falling OI. One has conviction behind it. The other is running on exits, not entries.
The 4 OI and Price Combinations — The Core Framework
This is the table every trader should memorize. When you see price and OI moving together, this table tells you exactly what it means.
This four-scenario framework is the foundation of OI analysis. Before you read anything else, read OI and price together using this table.
Long Buildup vs Short Covering—Why the Difference Matters
Both long buildup and short covering make prices go up. But they are completely different situations—and treating them the same way is a common mistake.
Long buildup happens when new buyers open fresh positions. OI rises alongside price. This tells you that market participants believe the move will continue. The strength is genuine. The momentum is supported by committed capital.
Short covering happens when traders who had bet on the price falling are now forced to buy back their positions to limit losses. Price rises, but OI falls. There is no new conviction coming in. As soon as the short sellers finish covering, the buying stops.
If you buy into a short-covering rally without checking OI, you may enter right when the move is ending.
How to Read OI on NSE — Step by Step
NSE publishes live OI data on its website for free. Here is how to read it practically.
Step 1 — Go to NSE's option chain page for Nifty, Bank Nifty, or any F&O stock you are tracking.
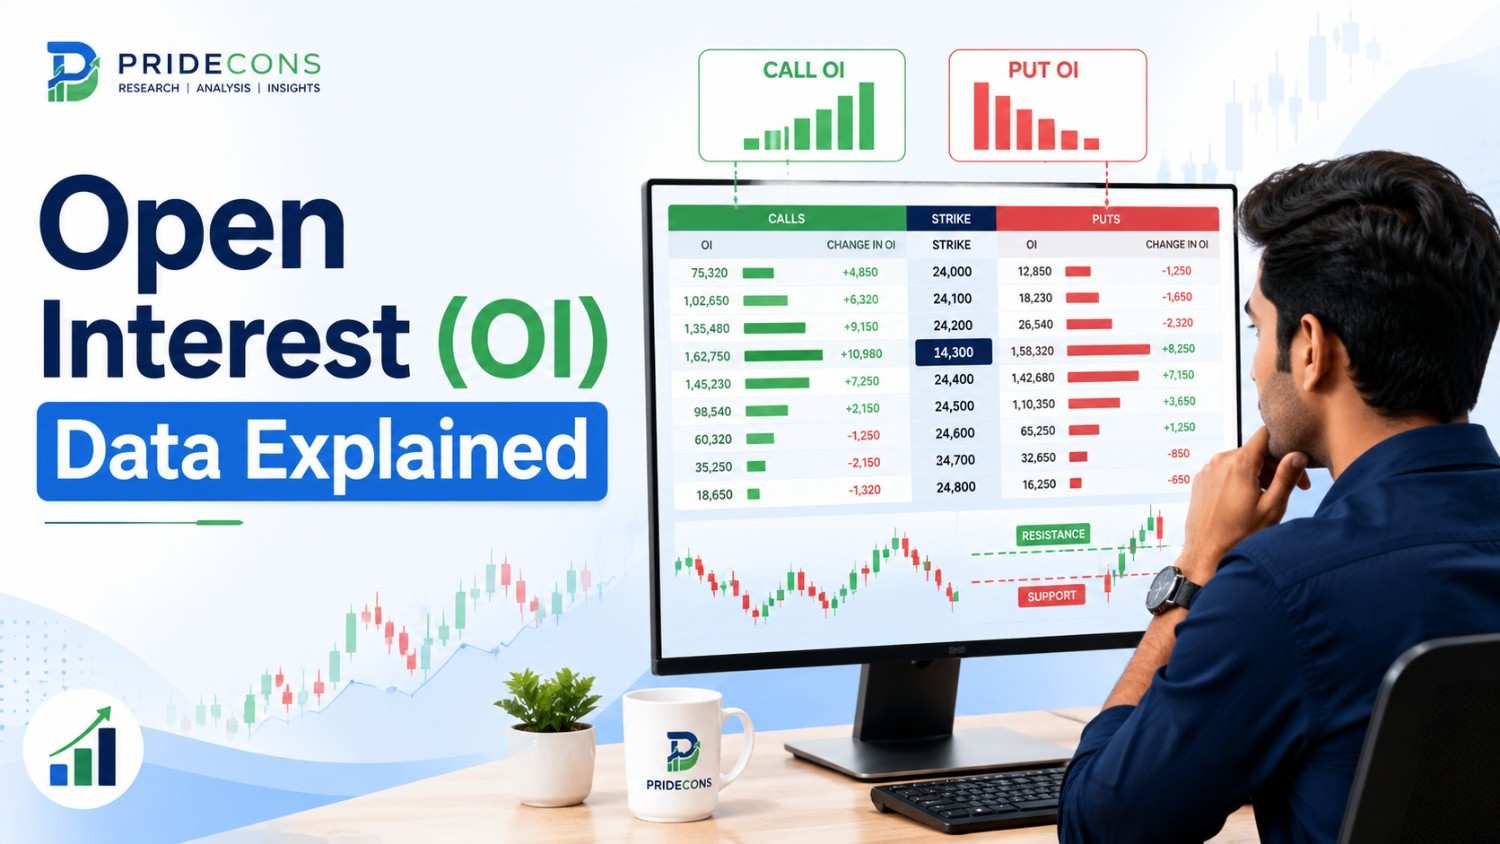
Step 2—Look at the call side and the put side separately. Identify the strike prices with the highest OI on each side.
Step 3 — The strike with the highest Call OI is your near-term resistance. Large sellers have written calls at that level, defending it.
Step 4 — The strike with the highest Put OI is your near-term support. Large sellers have written puts there, defending that floor.
Step 5 — Check the Change in OI column. This is more useful than raw OI. It shows which positions were added in today's session specifically—fresh money, fresh conviction.
Step 6 — Combine OI with volume at each strike. High OI with high volume confirms the level is active. High OI with low volume suggests older positioning that may not reflect current sentiment.
OI vs. Volume—Quick Comparison
These two are different tools. Both matter. Neither is complete alone.
Use volume to confirm what OI is telling you. High volume with rising OI means the signal is strong. Rising OI with low volume means the positioning is thin and less reliable.
Common OI Mistakes Traders Make
Mistake 1 — Reading OI without price direction. High OI alone means nothing. Rising OI with rising price is bullish. Rising OI with falling price is bearish. Never look at OI in isolation.
Mistake 2 — Ignoring Change in OI. Raw OI can be stale—built up over weeks. Change in OI shows what happened today. That is the number that reflects current conviction.
Mistake 3 — Treating all rallies the same. A rally on a long buildup and a rally on short covering look identical on a price chart. OI tells you which one it is. Only one of them is worth trading with fresh entry.
Mistake 4 — Assuming high OI equals a breakout signal. High call OI at a strike means big sellers are defending that level. The market struggles to break through. High OI at a strike is a barrier, not a signal to enter above it without confirmation.
Mistake 5 — Ignoring rollover and expiry effects. In the week before monthly expiry, OI data gets distorted as traders roll positions to the next contract. Do not misread expiry-week OI the same way you would mid-cycle OI.
Who Should Pay Attention to OI Data?
Key Insight
One line to remember: Price tells you where. Volume tells you how much. Open interest tells you who is committed—and whether the move has real money behind it or is simply running out of exits.
Conclusion
Open Interest is not a complicated concept. But it is one that requires you to stop looking at price alone and start asking a different question: is this move supported by fresh conviction, or is it just old positions being squared off?
Once you build the habit of checking OI alongside every price move you analyze, you will find yourself catching breakout traps earlier, avoiding short-covering rallies, and entering genuine trend moves with much more confidence.
The data is free on NSE. The framework is simple. What it requires is practice and patience — which is what separates consistent traders from everyone else.
At PrideCons, our research integrates OI analysis as a core part of how we evaluate market setups. As an SEBI-registered research analyst firm (INH000010362), we help traders in India build structured, data-driven approaches to the market—not guesswork.
Disclaimer
This article is for educational and informational purposes only. It is not financial advice and should not be treated as a recommendation to buy or sell any security or derivatives contract.